

.50
In Fed. Speak: "We gon' party like it's your birthday"

So we got a .50 cut last week. Markets then spent the remainder of the week figuring out how to digest it.
Historically, when rate cuts occur with stocks at or near all-time highs its been a mixed bag:

As speculators, the historical averages tell us very little. We need to make our decisions day-by-day, pivot by pivot, and set up by setup.
Work Flow
I haven’t haven’t posted in a while. In truth, I’ve been more interested in U10 youth Soccer than in talking about the market. But the Market is jealous mistress and it always drags you back (My kid’s games today were were also rescheduled due to storms). So as a reintroduction to my substack, I thought I’d share how I prepare my game plans for the market.
Market Breadth
When I start preparing my game plays for the week, I typically start by checking the market’s temperature with the McClellan and the McClellan Summation Index ($NASI). This is not something I do every day, but I will check it after big days or once a week when I’m making a longer watch lists.
The McClellan - Briefly hit an over-bought 100 before coming off a bit. I read this as neutral. It can stay firm and keep bouncing against the overbought levels OR if the market comes off it has a lot of room to oversold.
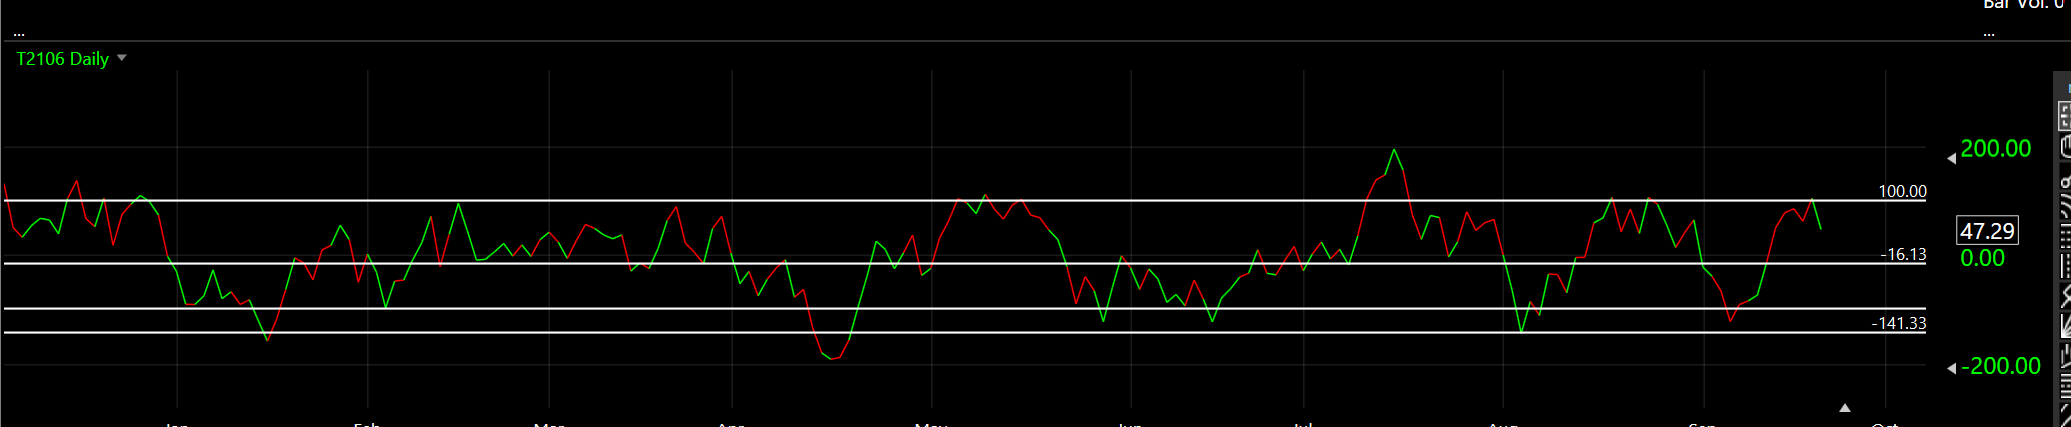
NASI - The “NASI” ( I use the TC2k Version which is the NYSE but not statistically different from the traditional NASI) had a bullish hook and Slingshot crossover. As a result, I’m long biased here. I’m also aware then it can get overbought pretty quickly and then I’ll need to be more defensive in my positioning.

Individual Setups
Market breadth just tells us generally which way to look but to make money in the market you need to be able to buy right.
There is no shortage of stocks near buy points major pivot breakouts.
Big Tech. The big tech names META 0.00%↑ TSLA 0.00%↑ AAPL 0.00%↑ NVDA 0.00%↑ are great for gauging institutional money flow. When those stocks are trending higher or breaking out it means money is flowing into the market.
AAPL:
A big tech stock right below the pivot. It had a pivot failure on Friday but still remains on watch. Alert set at 230.

META - already broken out.

The next thing I’ll do is go through my individual lists of stocks and note significant price consolidations and pivots. These go on a separate watch list.
U 0.00%↑ For example, has a clean pivot level at 21. As it pushes through want to monitor to ensure demand starts building above the pivot. That’s the buy signal.

Same for TWLO 0.00%↑

If I take the position, I’ll set the stop below congestion and let it work. If it spikes hard, I don’t want the pivot to be lost — I.e. an Icarus failure, so the stop gets moved up to in the money or just below the pivot.
Rinse, Wash, repeat.
Cheers.
“Not Investment Advice Disclaimer”
The content covered in this blog is NOT to be considered as investment advice. I'm NOT a financial adviser. These are only my own personal and speculative opinions, ideas, theories, hypotheses, charts, technical analysis (TA), insights, curated news publications, and price prediction(s).
Affiliate Link Disclaimer
The Speculator’s Journal may contain links to affiliate websites, which means I receive an affiliate commission for any purchases made by you on the affiliate website using such links.
How do you spot new trading themes that tend to emerge after events like the U.S. election? Do you rely more on macroeconomic shifts like interest rate trends, sector rotation indicators, earnings reports, or real-time signals from news and social media? Curious to hear your approach!